The new Paginated Report visual is here!
Last Friday Microsoft put out the Power BI June 2021 Feature Summary which included the much awaited Paginated Report visual. I’ve been waiting for this rather impatiently for the past few months and am thrilled that it is finally here. Read Chris Finlan‘s full post about the Paginated Report visual here: Paginated report visual for Power BI reports is now available in public preview.
In my working world we utilize Paginated Reports quite heavily and the release of this visual is truly game changing. Now instead of having to move from between Power BI reports to visualize data the way that you want to see it, you are finally able to interact with the data in a single, seamless report. This also opens the Paginated Reporting world to lots of more people who may not have considered this report type until now.
I sat down to write this blog post and apparently I had quite a bit to say because what was meant to be a simple blog post turned into a 30 page white paper. In the white paper I cover a simple reporting solution that I want to utilized a Paginated Report in, how to use a SharePoint Online list a the tracking mechanism, how to create a simple paginated report, how to publish the report into the Power BI Service, and finally how to utilize the new Paginated Report visual in a Power BI Report canvas. The last one of these is what I am going to focus on in this post.
If you want to find the full white paper please feel free to click here to access it. To read about is just the new Paginated Report visual, the please continue reading! One thing to keep in mind with this post… it is a excerpt from the white paper, so anything that doesn’t quite make sense probably does in the context of the full white paper. Here goes!
Using the Paginated Report visual in the Power BI Report
Setting up Power BI Desktop
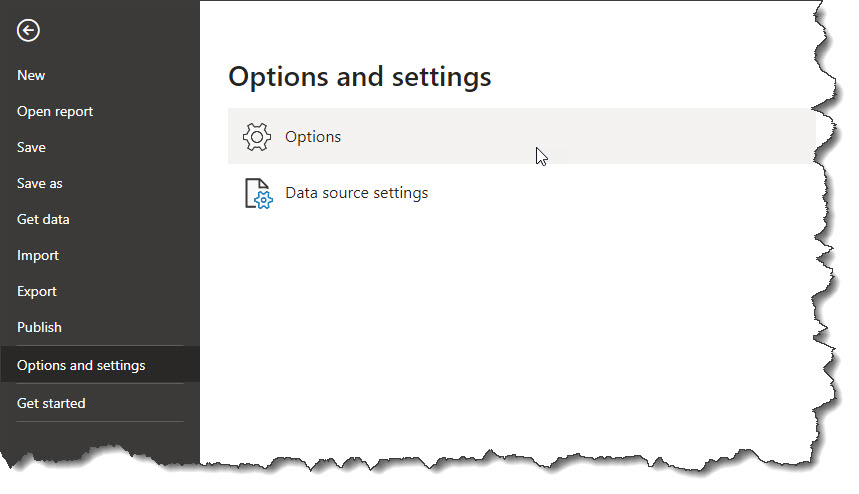
The Paginated Report visual became available in the June 2021 update of Power BI Desktop as a Preview Feature. This means that you must manually enable it once you have updated to the June 2021 version of Power BI Desktop. To do this you go to File | Options and settings | Options.
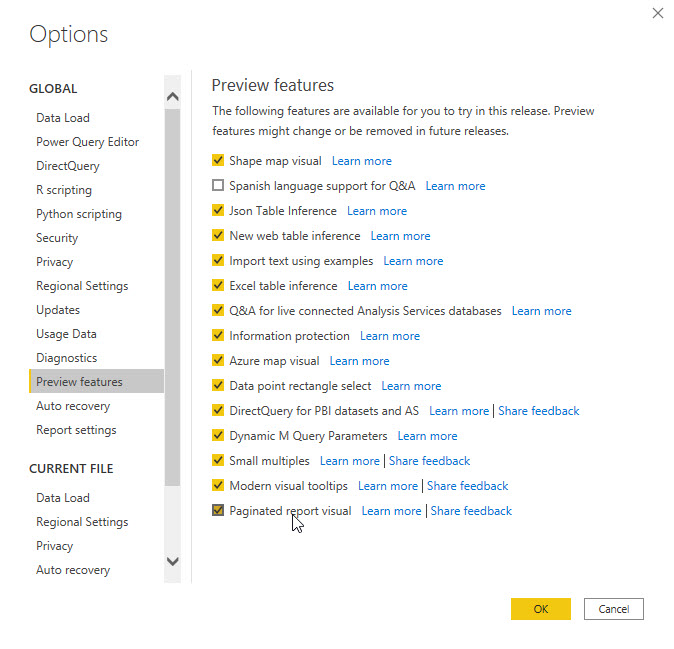
Next go to Preview features under GLOBAL and check the box for “Paginated report visual”. We will be required to restart Power BI Desktop once you are done with this step.
Adding the Paginated Report Visual
Now that Power BI Desktop is reopened we will find the Paginated Report Visual in the Visualizations pane.

Once we click the visual icon it will drop into the open space on the canvas, and we can resize it to your desired size.

Configuring the Paginated Report Visual
Now we can connect to a report. Click the big yellow button and the screen will change to show us the available Paginated Reports that you can choose from.
Once we select the Report, we need to add in Parameters before moving forward. Drag the Date & Day Name Fields into the Parameters field in the Visualization pane.

After we have done that we will want to change the Date from a hierarchy to a single date so that it can be sliced properly.

Next, we click the “Set Parameters” button and change the parameters from the “use default” option to the specific Power BI fields that we want to use. Once that is done, we click the “See Report” button.

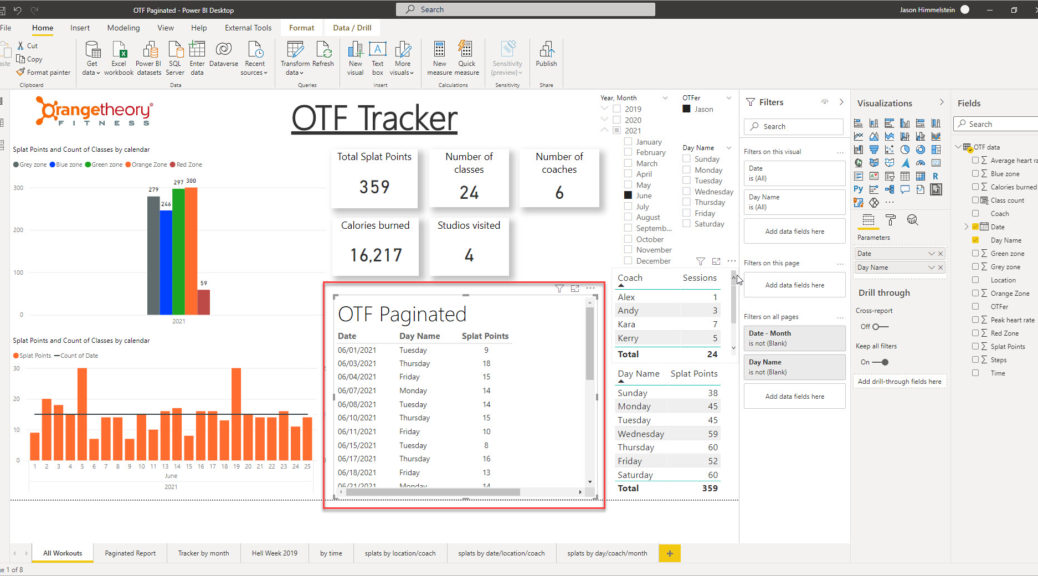
Once the report renders, we will see the Paginated Report showing up in the visual space we placed it in and filtered to match the rest of the Power BI Report.

Using the Paginated Report Visual
If we change the month from June to May in the Year,Month slicer we will get a dialog at the top left of the Paginated Report visual that says “Apply Changes” while the rest of the report simply changes. This is the default setting as of the June 2021 release and allows us to not have to wait for the Paginated Report visual to refresh, which takes longer than the other visuals, incase we want to tweak our slicers a few times before seeing the Paginated Results.
This behavior changed under the Formatting tab of the Visualizations pane when the Paginated Report visual is selected. That can be tricky at times, so I recommend using the Selection pane (found under the View menu in the ribbon) to help us get this visual selected.
In the formatting options we will find “Auto-apply filters” as a toggle. We will only see “Auto-ap…” as the default layout of the Visualizations pane is small. Once toggled we will see the “Apply changes” box disappear, and it will automatically refresh as we change the slicers.

While we are making updates in the Visualizations pane, I would encourage you to enable the Toolbar in the visual so that you can do things like change pages and Export data to all of the formats Paginated Reports is able to export to.

Conclusion
I hope that you find the Paginated Report visual as amazing as I do. It is going to change the way my customers work with their data.
If you want to find the full white paper please feel free to click here to access it.